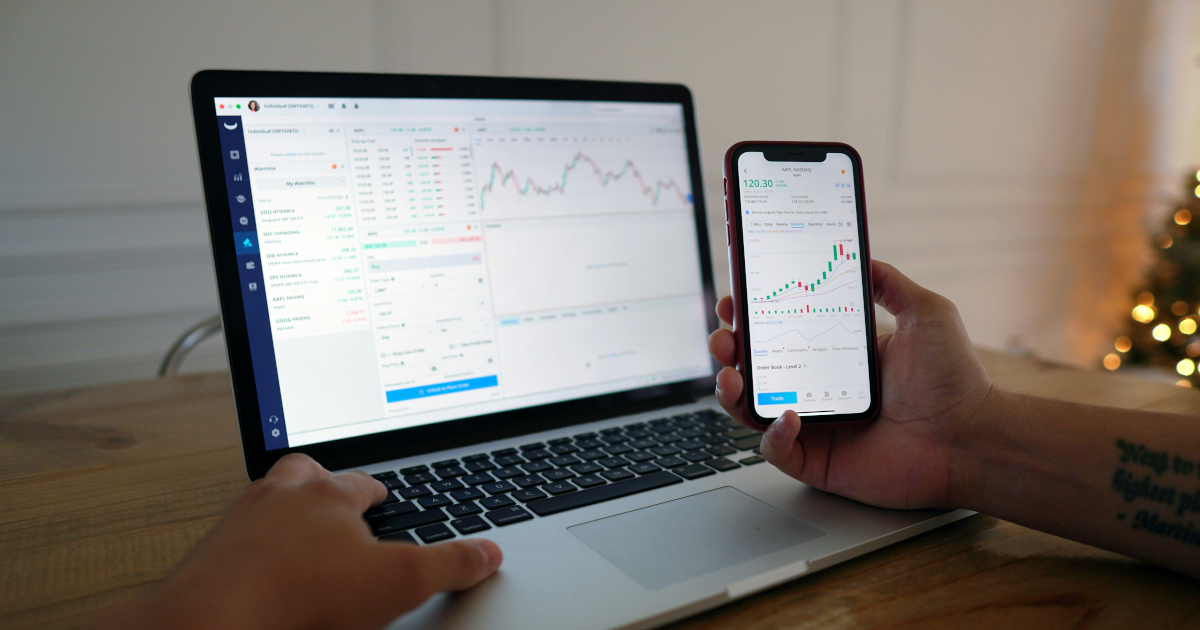
As the artificial intelligence race continues to dominate stock market discussion, traders and investors are turning to options market data to better understand risk sentiment in the technology sector. According to a report by Jim Wyckoff of Benzinga, the Nasdaq-100 Index Options (NDX) and Nasdaq-100 Micro Index Options (XND) are becoming essential tools for tech traders seeking insight into near-term price direction and volatility.
Options data such as price action, volume, and open interest can provide valuable clues about where a market, stock, or index may be headed. For the technology sector—including semiconductors that have commanded overwhelming attention as the AI race evolves—NDX and XND options offer a window into how the marketplace is reading future price trajectories. The two derivatives track the same top 100 non-financial companies listed on Nasdaq but differ in contract size and affordability, with XND fixed at 1/100th of the full NDX value and carrying a $100 multiplier, making it accessible to retail traders.
The put/call ratio (PCR) is one key metric. A high PCR suggests more trader anxiety and a bearish bias, while a low PCR indicates keener risk appetite. Some experienced traders also use extreme PCR readings as contrarian indicators for potential trend reversals. During periods of higher volatility, options premiums—known as implied volatility—typically increase, serving as both a gauge of present market risk and an indicator of likely daily price swings. Given recent volatility in the tech sector, implied volatility in NDX and XND has become an especially important indicator, with notable surges leading up to second-quarter high-tech earnings reports.
Skew—the pricing difference between out-of-the-money puts and calls—is another critical measure. A steep skew, where put premiums and implied volatility rise faster than calls, suggests keener risk aversion and bearish sentiment. Open interest clusters at specific strike prices can also reveal targeted upside resistance or downside support levels, while volume spikes in puts or calls reflect aggressive directional trades or institutional hedging.
The Cboe-Nasdaq 100 Volatility Index (VXN) provides a real-time measure of expected 30-day volatility for the Nasdaq-100, offering a more focused reading on tech sector sentiment than the broader VIX. Rising VXN readings suggest increasing anxiety among tech traders, while declining readings indicate a calmer sector. For those seeking further educational resources on options, the Options Clearing Corporation provides materials and can be reached via visitwww.888options.com.
The report was originally published on Benzinga, with further disclosures available here. The original release can be viewed on www.newmediawire.com.
As technology stocks become more popular and more volatile, monitoring these options metrics is likely to remain a priority for traders aiming to position themselves for profitable trades while managing risk in an increasingly complex market environment.